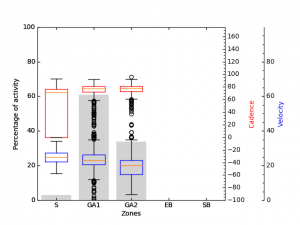
Effective training is key to build a strong foundation for competition. That’s why I am using the Strava API with Python to analyze Strava training activities. I started my winter training recently and wanted to make sure I’m training effectively. Especially, I want to see if I stay in the right zones during the training. I have set up my Forerunner alarms appropriate, but I train outdoor, so it goes up and down during the run and I can’t control everything during the ride. Human. Not robot.
I started with the stravalib library, for reading the data from the API. As usual in data science, I need to transform and prepare the data for visualization. I end up storing the generated plots and build a quick & dirty HTML-file to display the stuff. I will now guide you through the example. I will explain the important steps. You can find the complete code on https://github.com/marquies/strava-viz.
Leave a Comment